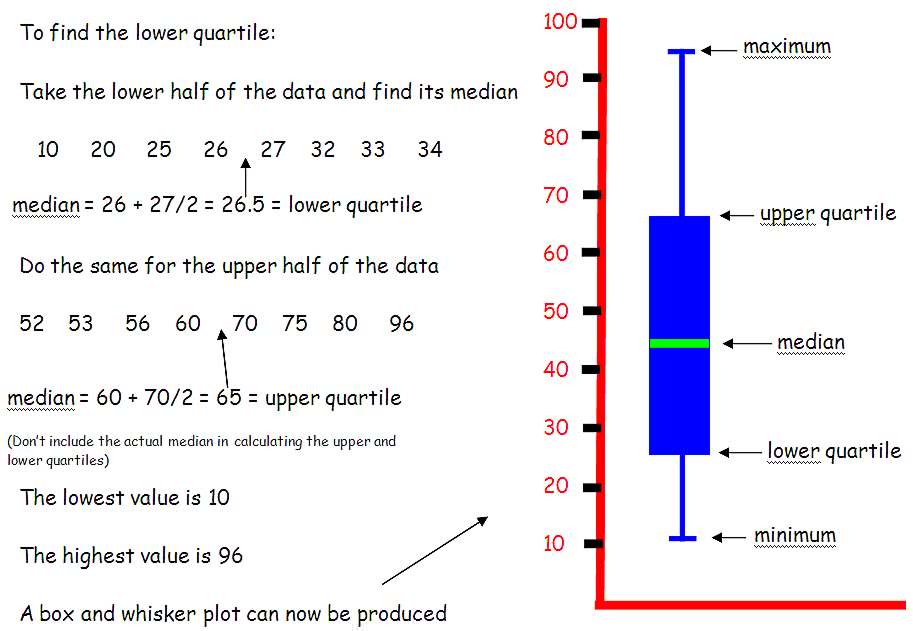
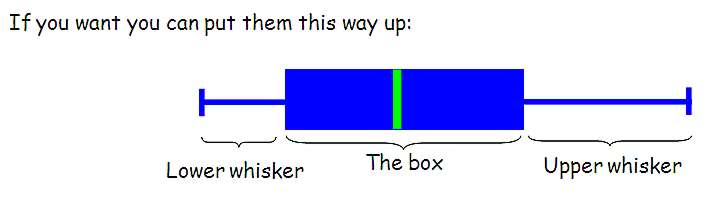
Box and Whisker Plots
These are a simple way of displaying the median, upper and lower quartiles and range of a set of data. You know what the median is (see above), the range is the distance from the highest to the lowest piece of data. A quartile is the value that is half-way between either the lowest or highest value in the data set and the median. Hence, you have an upper quartile (above the median) and a lower quartile (below the median).
Here is some data:
10 20 25 26 27 32 33 34 43 52 53 56 60 70 75 80 96
The median is 43